
Similar to Windows Task Manager, Ubuntu offers a system monitoring utility that will display running processes, memory usage, file system usage. Apart from monitoring, you can also take several actions from the system monitor user interface — such as killing a running process.
In this article, let us review how to put the basic monitoring options right on the task bar panel on Ubuntu desktop.
Add System Monitor to Ubuntu Task Bar Panel
Right click on the task bar panel and click on ‘Add to Panel’ as shown below.
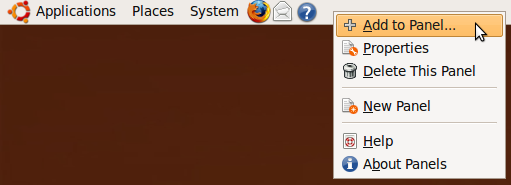
Fig: Launch – Add to Panel
Search for the term “system” -> select “System Monitor” and -> click on “Add” as shown below.
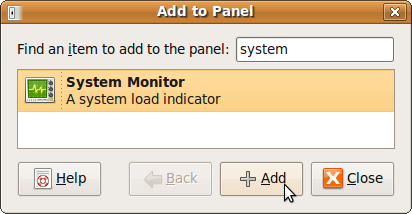 Fig: Search System Monitor and add to Panel
By default this will only add the processes usage graph as shown below.
 Fig: Processes Usage Graph on Ubuntu Task Bar Panel
Add Memory Usage, Load Average and Disk Usage Graphs to Ubuntu Task Bar Panel
Right mouse click on the Processes graph that is displayed on the task bar panel, and select ‘Preferences’. Select the following check-boxes under the ‘Monitored Resources’ section. You can also choose Network, or Swap Space if you like to monitor those.
- Processor (already selected)
- Memory
- Load
- Harddisk
By default it displays the memory usage in green, cache in light green, process usage in blue, load average in red. You can change the colors, and the refresh interval.
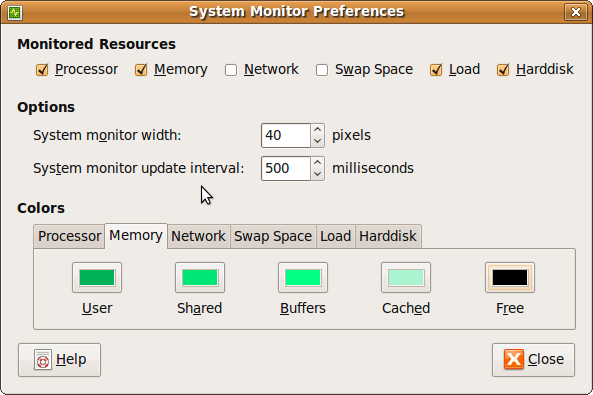 Fig: Ubuntu System Monitor Preferences
After the above selection, you’ll see 4 graphs in the Ubuntu task bar itself as shown below.
 Fig: Multiple graphs displayed on the Ubuntu task bar
Ubuntu System Monitor GUI
To view the system monitor in a bigger window, right click on any one of the system monitor graphs in the task bar, and click on “Open System Monitor”, which will display the System monitor in the bigger window as shown below.
From the Processes tab, you can view all the process along with their status, %CPU usage, memory used by the process etc., You can also kill a process directly from here.
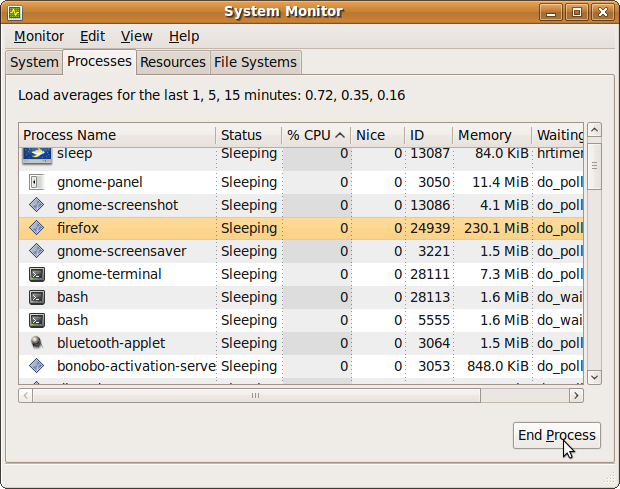 Fig: Ubuntu System Monitor – Processes tab
The file systems tab displays the disk usages.
 Fig: Ubuntu System Monitor – File Systems tab
The resources tab displays last 60 seconds of data in three different graphs for CPU, Memory and Network.
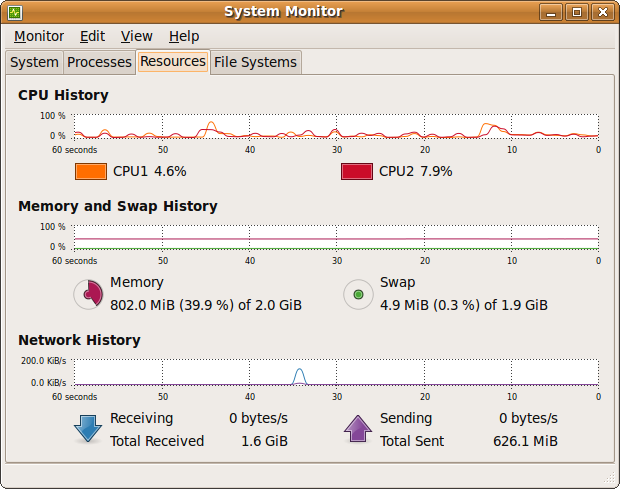 Fig: Ubuntu System Monitor – Resources tab


 My name is Ramesh Natarajan. I will be posting instruction guides, how-to, troubleshooting tips and tricks on Linux, database, hardware, security and web. My focus is to write articles that will either teach you or help you resolve a problem. Read more about
Comments on this entry are closed.
Actually, it’s the GNOME project that provides this tool.
Ubuntu simply packages GNOME as part of it default release. Other releases of Ubuntu such as Kubuntu and Xubuntu which don’t include GNOME, will also not include this tool.
@Paul,
Thanks for clarifying that this tools is available as part of GNOME and not available on other releases of Ubuntu.
Great list. I was having problems with firefox using a ton of memory and using these came in very handy. Thanks.
The Gnome System Monitor itself uses way too much CPU time. While they’ve taken some steps to resolve this, I’ll still take htop over GSM any day.
What does the ‘load’ graph represent?
I just launched System Monitor on my Ubuntu 12.04 LTS for the first time, and expected an equivalent of Process Explorer on Windows. The only problem is that System Monitor itself is on top of the CPU % list, taking up to 35 % of processor resources. Well, that’s what I call a big problem…
I am very disappointed at the route Ubuntu has taken in the last couple of years. They seem to have neglected performance optimizations and the OS has become a huge memory hog.
I’d actually like to see if it’s possible to set a memory/cpu limit on a per process basis (including it’s children). Good article thought – I seem to forget there should be some obvious things like the system resource widgets…