If you’ve installed nagios, and using it to monitor remote linux or windows server, you know that you can use the nagios web UI by going to the URL: http://{your-nagios-server-ip}/nagios/
Probably you’ve even defined appropriate nagios contacts, which will send a SMS messages to your cellphone about any critical issues.
At work, when you are always in front of your system, using the nagios checker browser add-on, you can keep an eye on what is going on with your servers and applications, just by looking at the browser status bar, which will display the current status of the servers and services monitored by the Nagios system.
Nagios Checker add-on is available on both firefox and chrome browser as extensions.
Nagios Checker for Chrome
Install the nagios checker chrome extension and restart the browser.
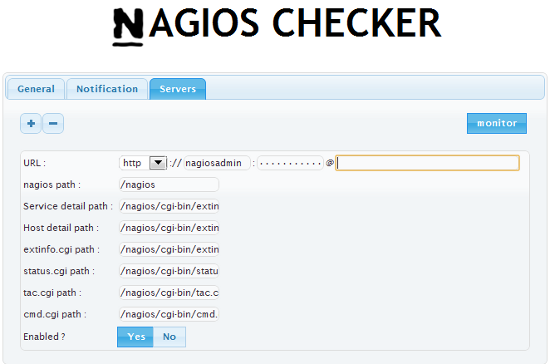
From Chrome, click on the ‘wrench’ icon on the top right corner -> Tools -> Extensions -> Click on ‘Options’ link (under Nagios Checker extension) -> Click on ‘Server’ tab, where you can enter the nagios web interface url as shown below.

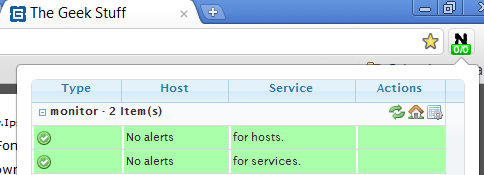
Once you’ve installed the nagios checker chrome extension and configured it, it will displays an icon next to the url bar (i.e before the ‘wrench’ icon). The icon will also show whether any hosts or services are having any issues. If the ‘N’ icon says “0/0”, there are no problems.
If you click on the ‘N’ icon, nagios checker will display additional information as shown below.

Nagios Checker for Firefox
Install nagios checker firefox add-on and restart the browser.
Go to Tools -> Add-ons -> Select ‘Nagios Checker’ -> Click on ‘Options’, which will bring-up ‘Nagios Checker Settings’ dialog box.
Click on ‘Add New’, which will let you add a new nagios system. In the general tab, enter the name of the monitoring system. for e.g. “monitor”.
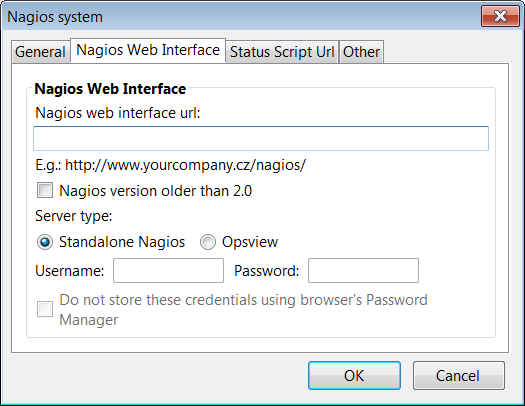
In the “Nagios Web Interface” tab, add your nagios web interface url, username, and the password, as shown below.

In the “Status Script Url” tab, enter the status.cgi URL, which should be: http://{your-nagios-server-ip}/nagios/cgi-bin/status.cgi
Once you’ve installed the nagios checker firefox extension and configured it, it will displays a nagios icon in the status bar at the bottom. The icon will also show whether any hosts or services are having problems. When everything is up and running, it will display “No problem” next to the ‘N’ icon. You can also right mouse click on this icon, and jump the nagios web UI directly.


 My name is Ramesh Natarajan. I will be posting instruction guides, how-to, troubleshooting tips and tricks on Linux, database, hardware, security and web. My focus is to write articles that will either teach you or help you resolve a problem. Read more about
Comments on this entry are closed.
Super plugin, will going to save lot of time. Thanks for the info.
Can you help setup monitoring Operfire XMPP Service via Nagios i am unable to use the check_tcp plugin.
Iam not able to upgrade my browser firefox from 1.5 to 3 or 4 ,which comes with default installation of RHEL5 ,
Can you please let me know how to upgrade my browser
to which i have tried everyway
can some body tell me how to import nagios checker config from Firefox to Chrome
Hi,
How to Add multiple in “Hosts matching regular expression” filed of filtering Tab in Nagios Checker Version 1.6.
Any help is really appreciated.
Thanks
Hi,
How to Add multiple in “Hosts matching regular expression” filed of filtering Tab in Nagios Checker Version 0.16
Any help is really appreciated.
Thanks
Why does Chrome require so many more fields than Firefox and where does one find the info? Are they all required?
Firefox version runs fine with URL, Username and cgi status location only?
Very very Thanks……….I am serching for Nagios alarmin’ GUIs…….Very usefull